Explore biodiversity
Explore terrestrial and marine maps, then browse taxa by evidence and source scope.
Applying the selected datasets and assembling their maps, records, and provenance.
Loading dashboard data…Connecting field samples, occurrence records, and DNA reference barcodes to document and preserve California’s undiscovered insect, fungal, and soil biodiversity.
Track an exact sample reference, explore public biodiversity evidence, inspect dataset provenance, or enter the protected operations workspace.
Use the exact Field ID printed on the sample label, such as CBR… or DVS-…. Protected sample families, including eDNA records, require the private share token sent by the project team — enter it here the same way.
For privacy, this lookup uses exact references only. It does not suggest nearby IDs, reveal precise collection locations, or confirm other records. Keep share tokens private.
Explore terrestrial and marine maps, then browse taxa by evidence and source scope.
Review dataset mappings, source links, overlap decisions, and current inclusion.
Coordinate field records, processing routes, collaborators, outputs, and priority requests.
CalATBI members — hundreds of scientists and scores of institutions — collect soil, insect, and eDNA samples across California.
Help collect samples →Partner labs run DNA sequencing, eDNA metabarcoding, flow cytometry, and chemical and bacterial analyses on every sample.
See the workflow →Verified results become open biodiversity records anyone can explore, map, and download.
Explore the records →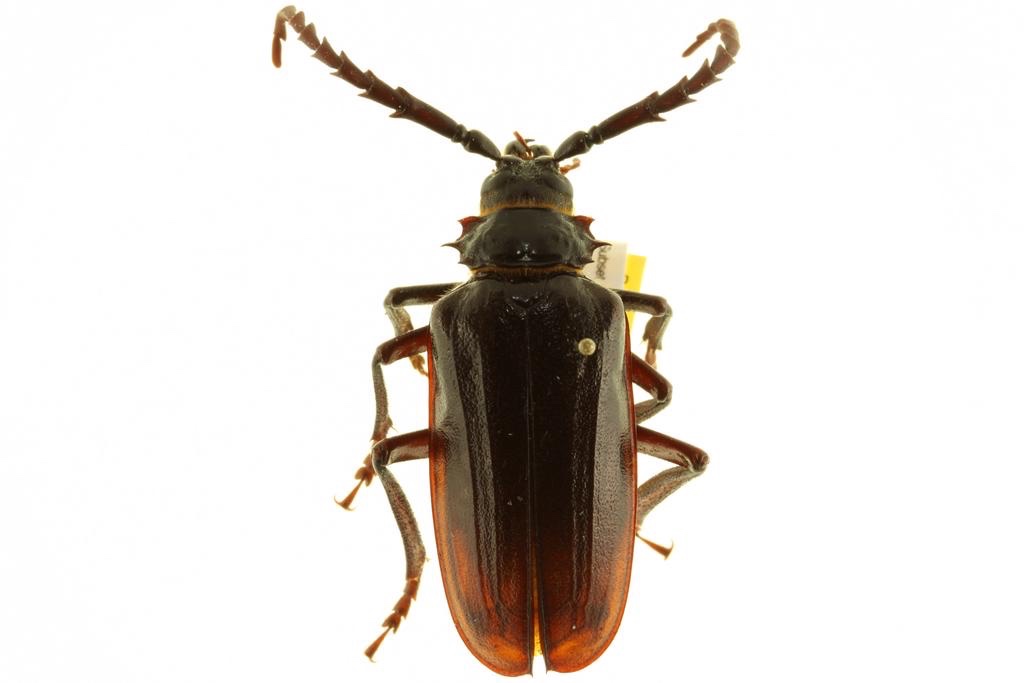
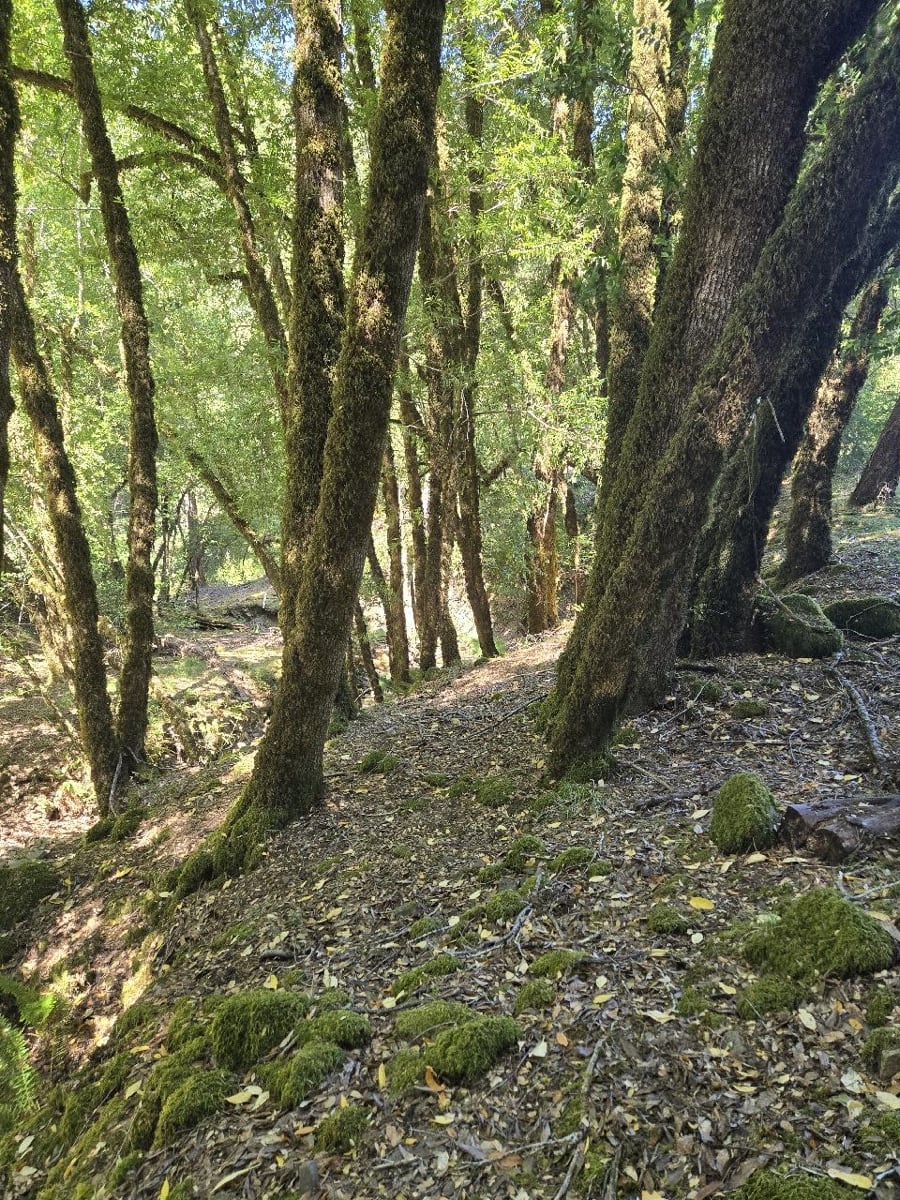
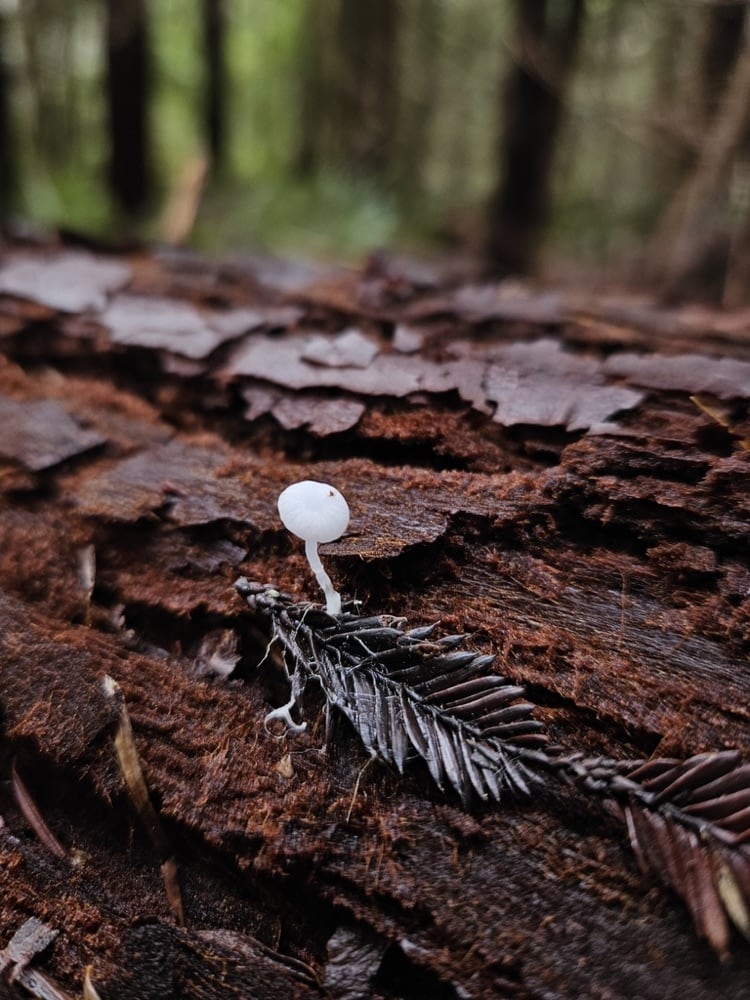
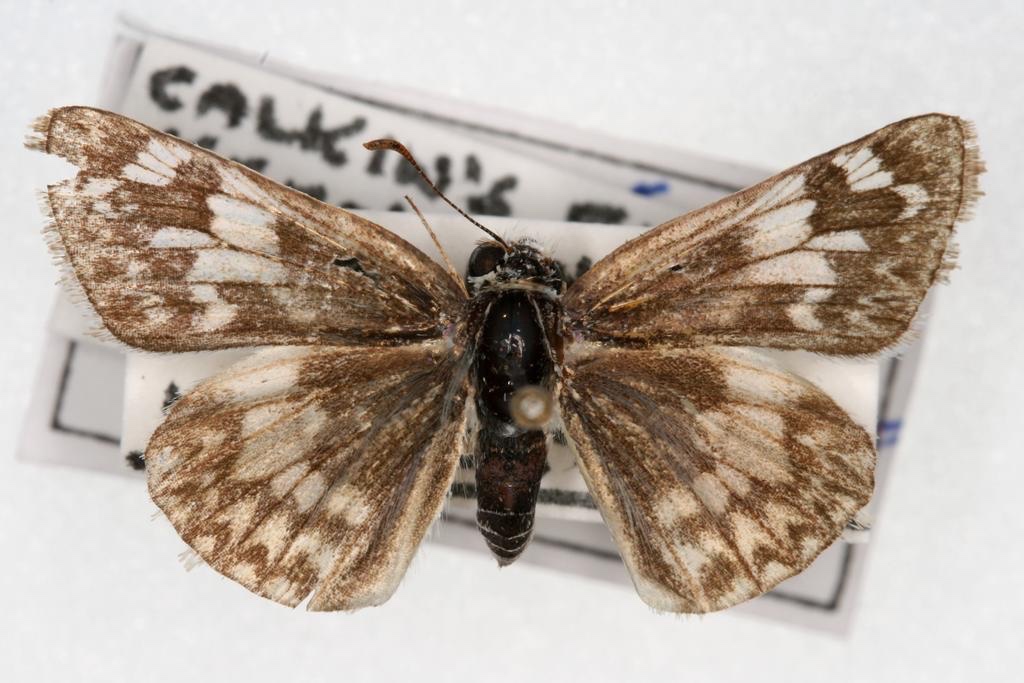
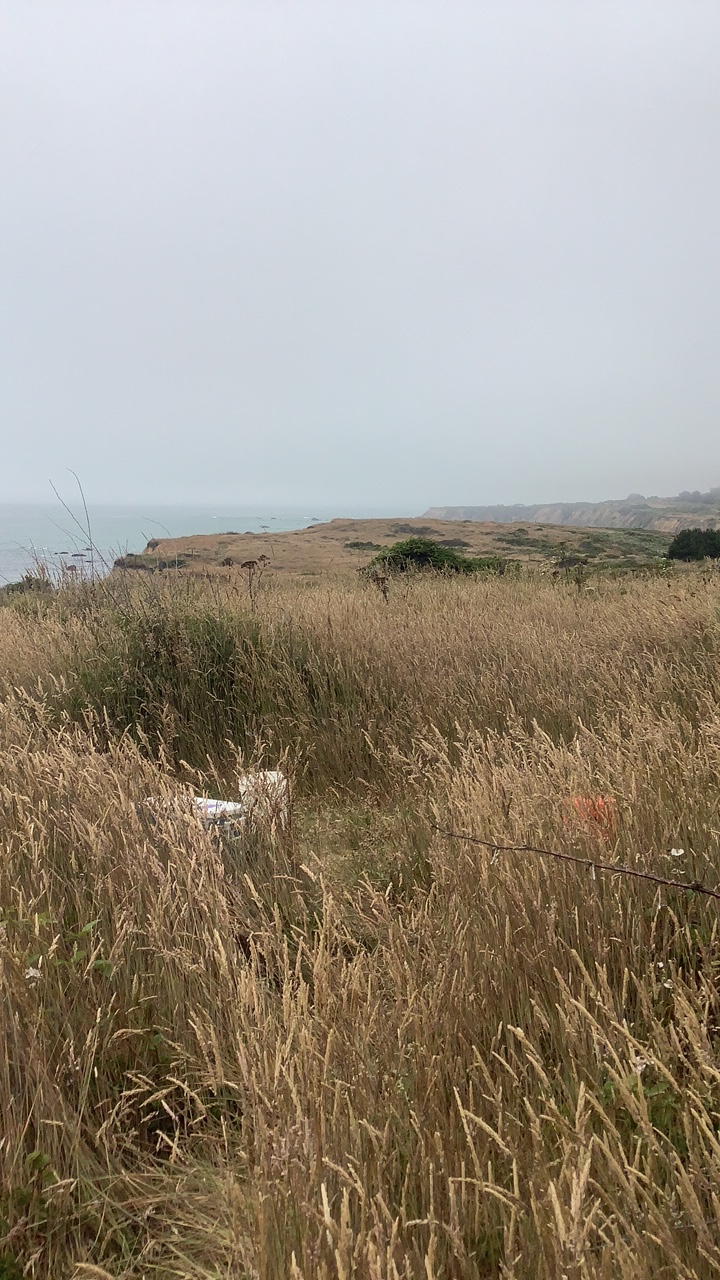
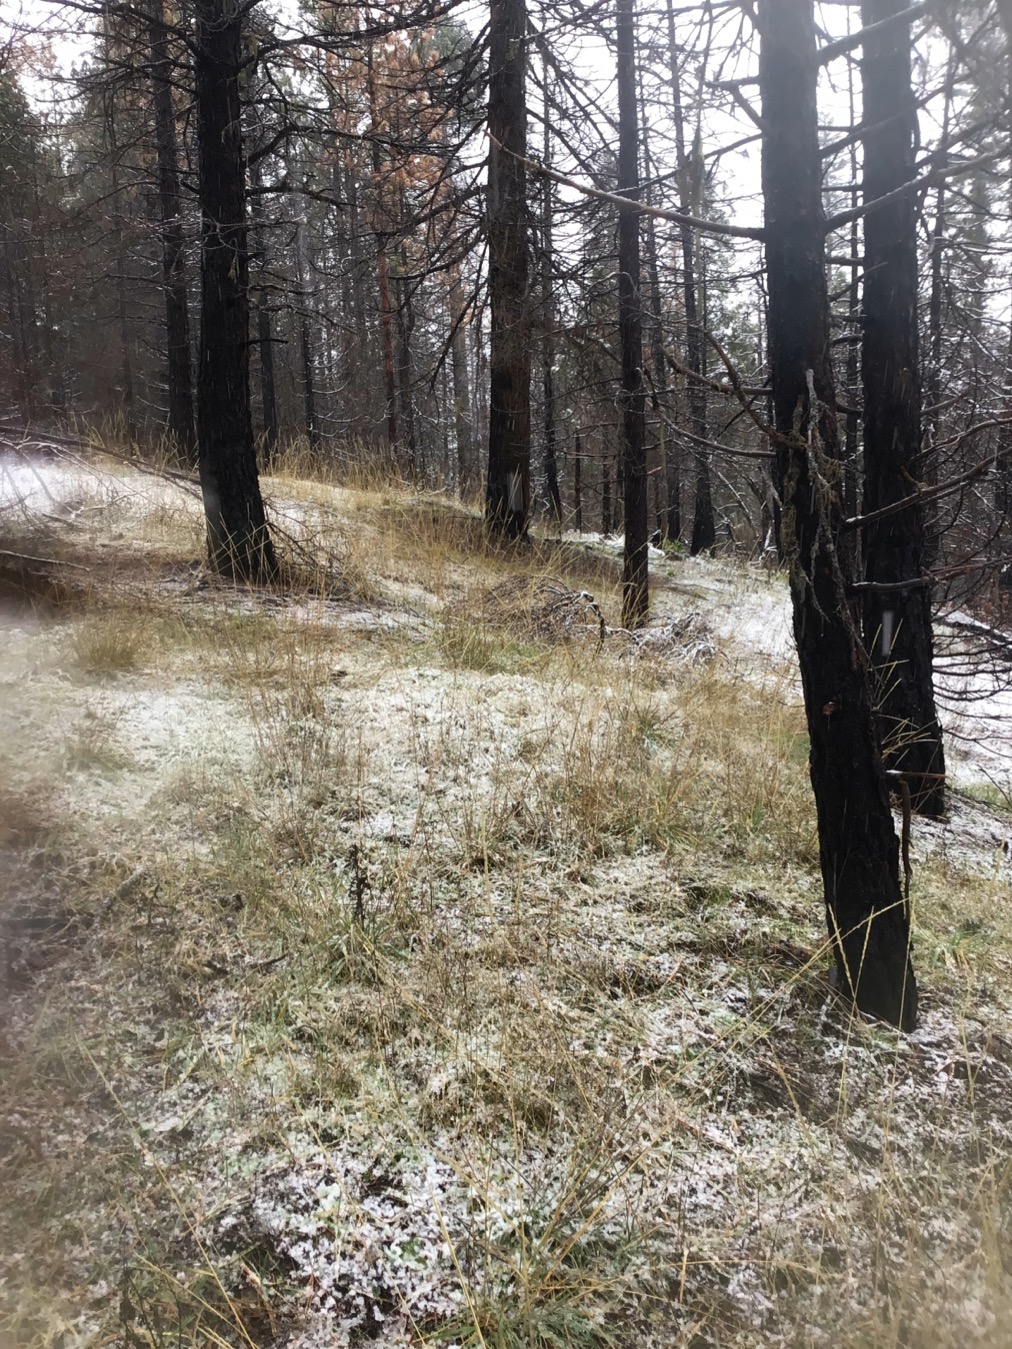
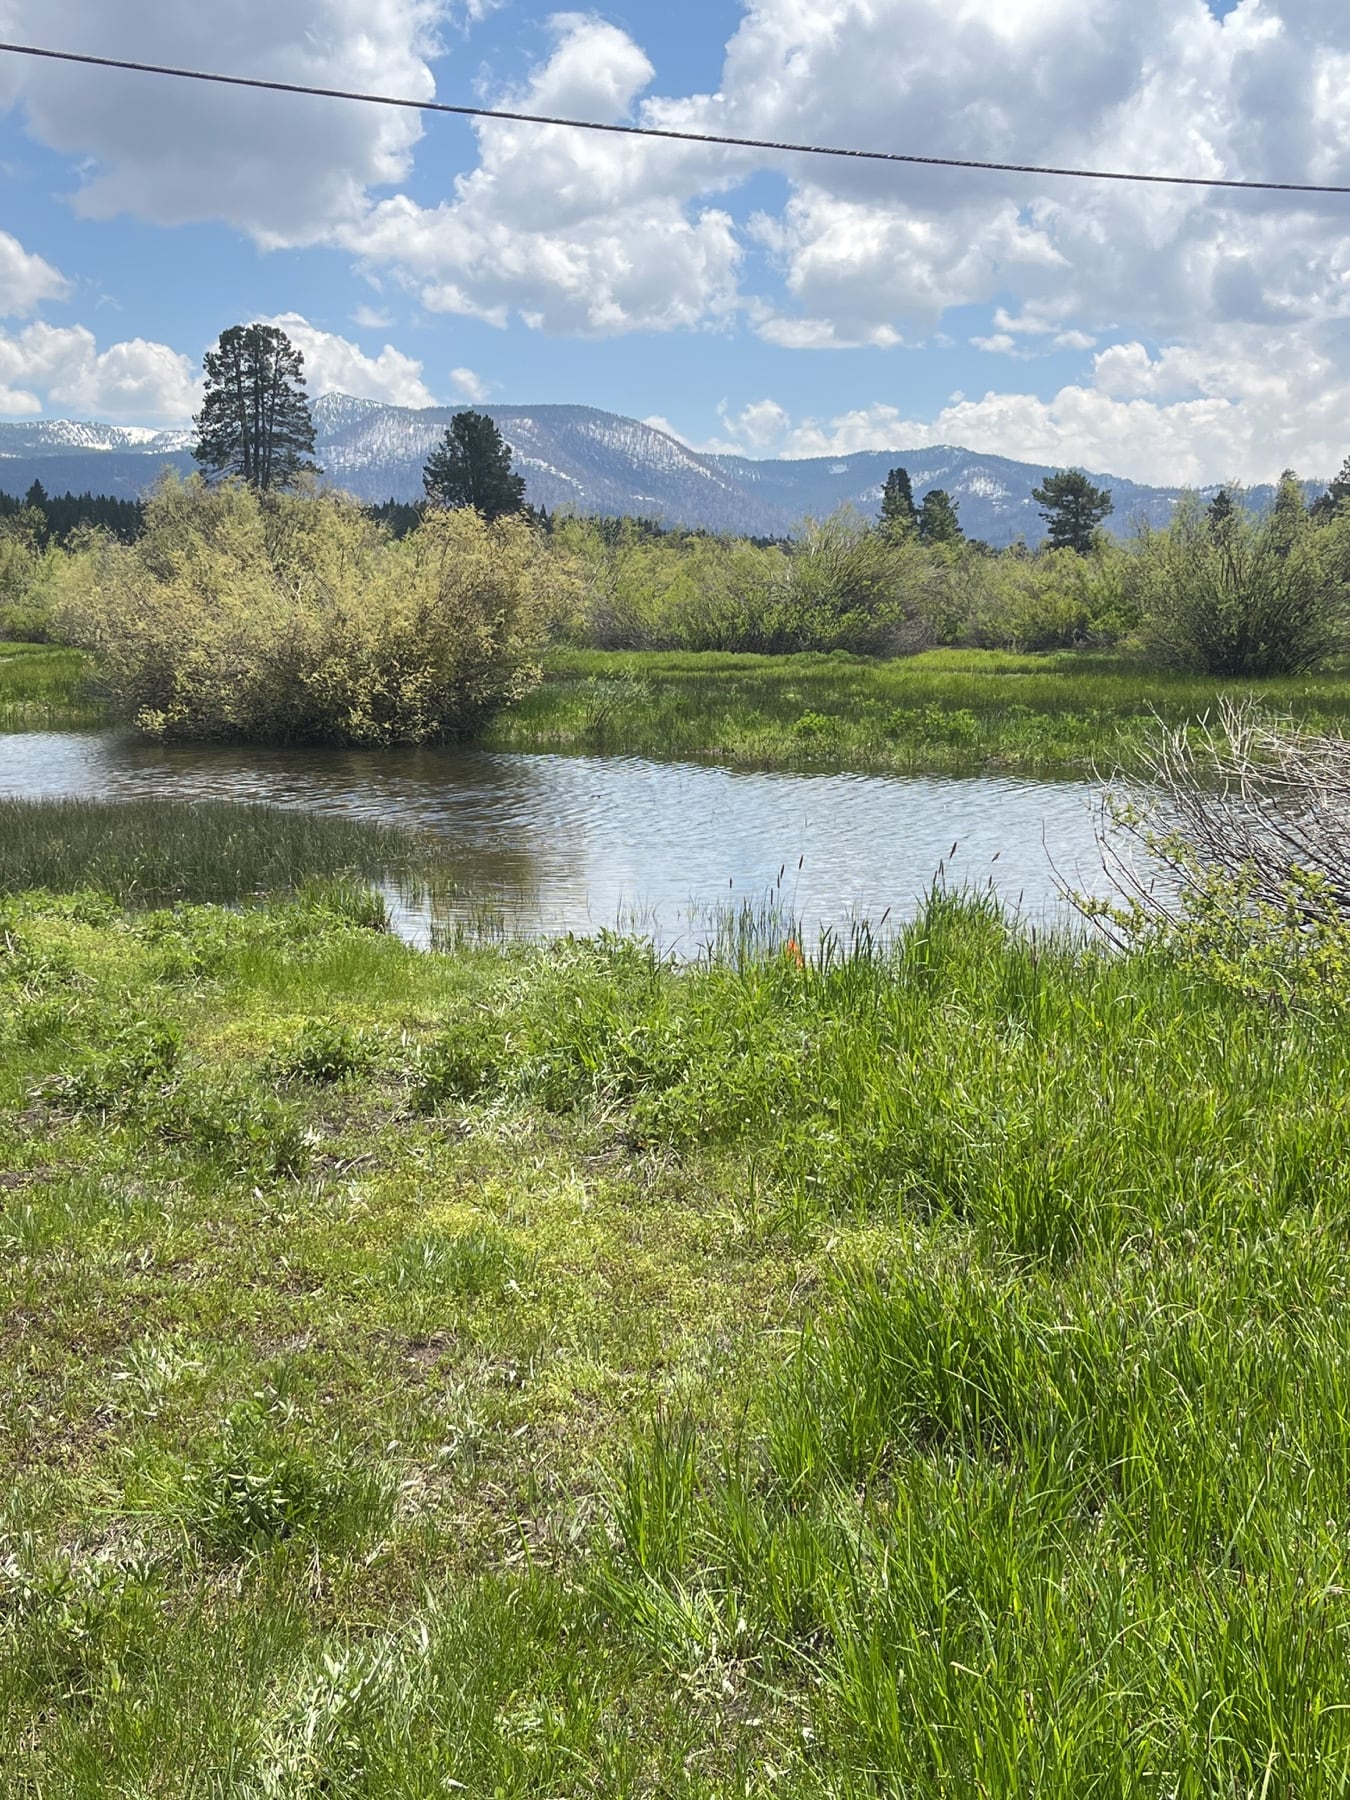
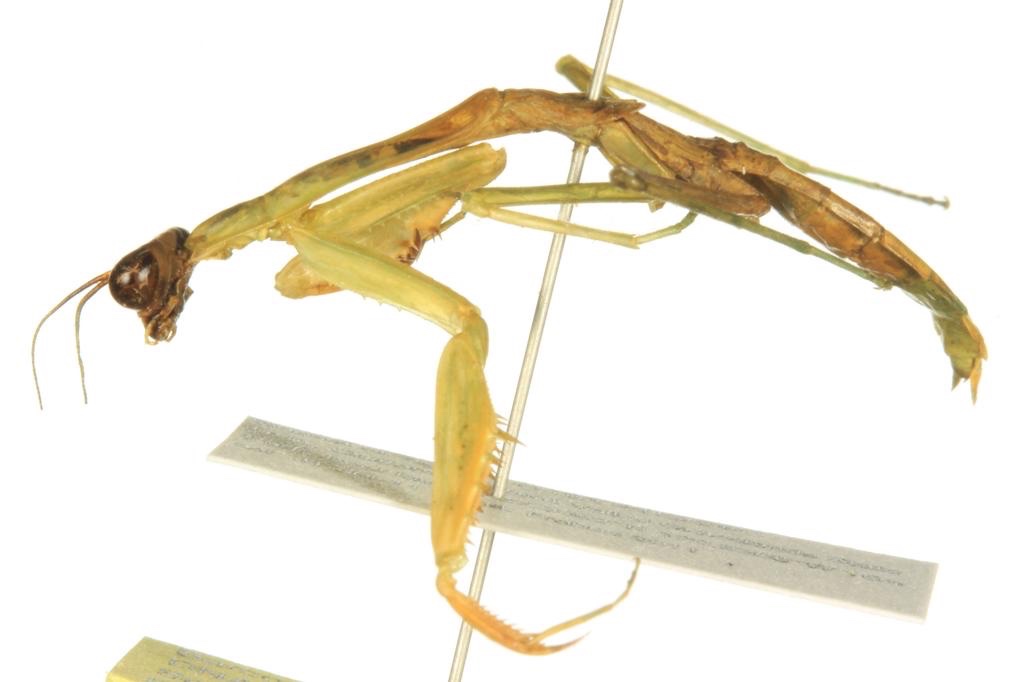
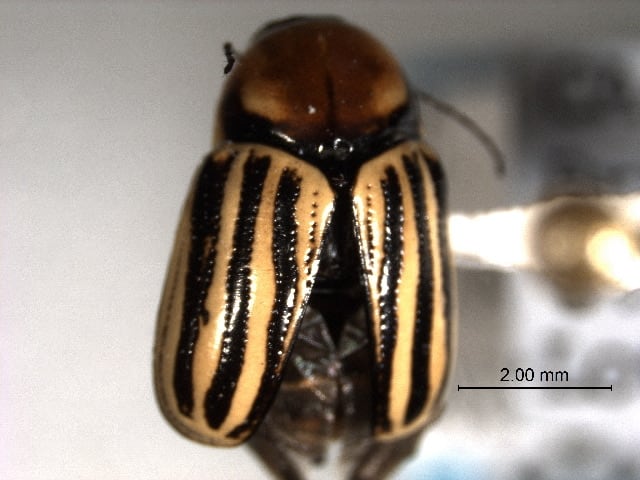
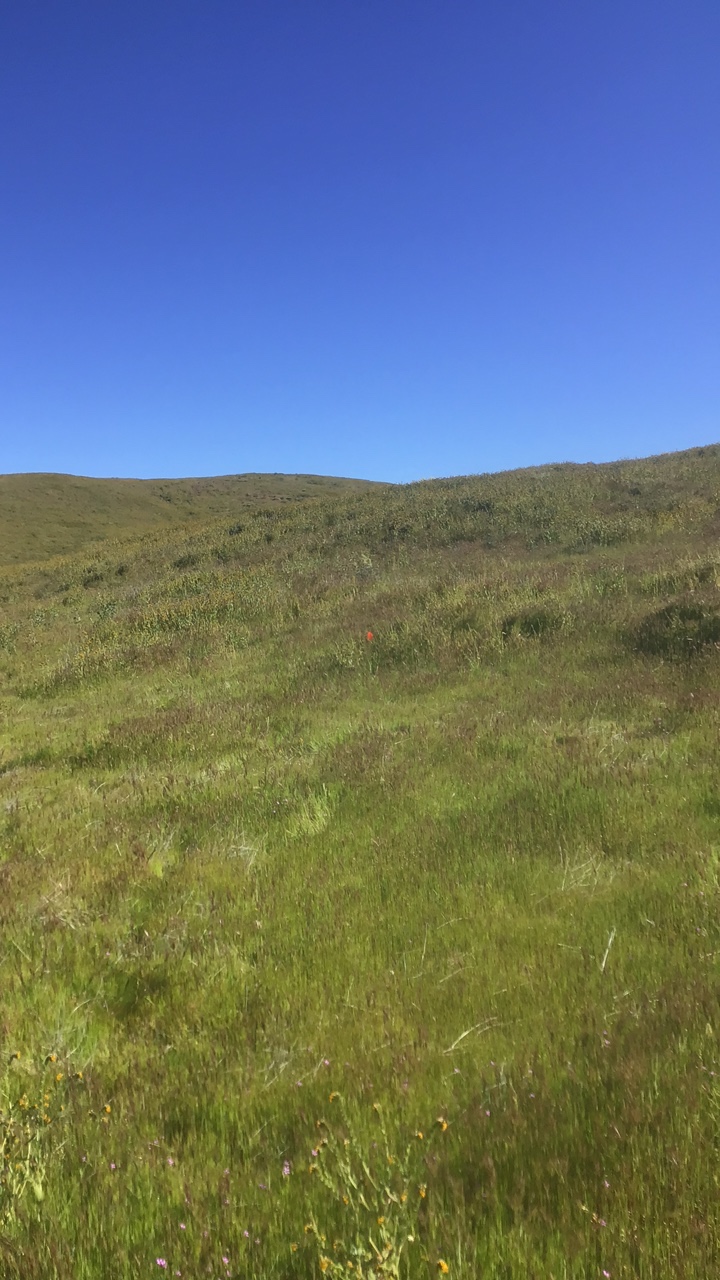
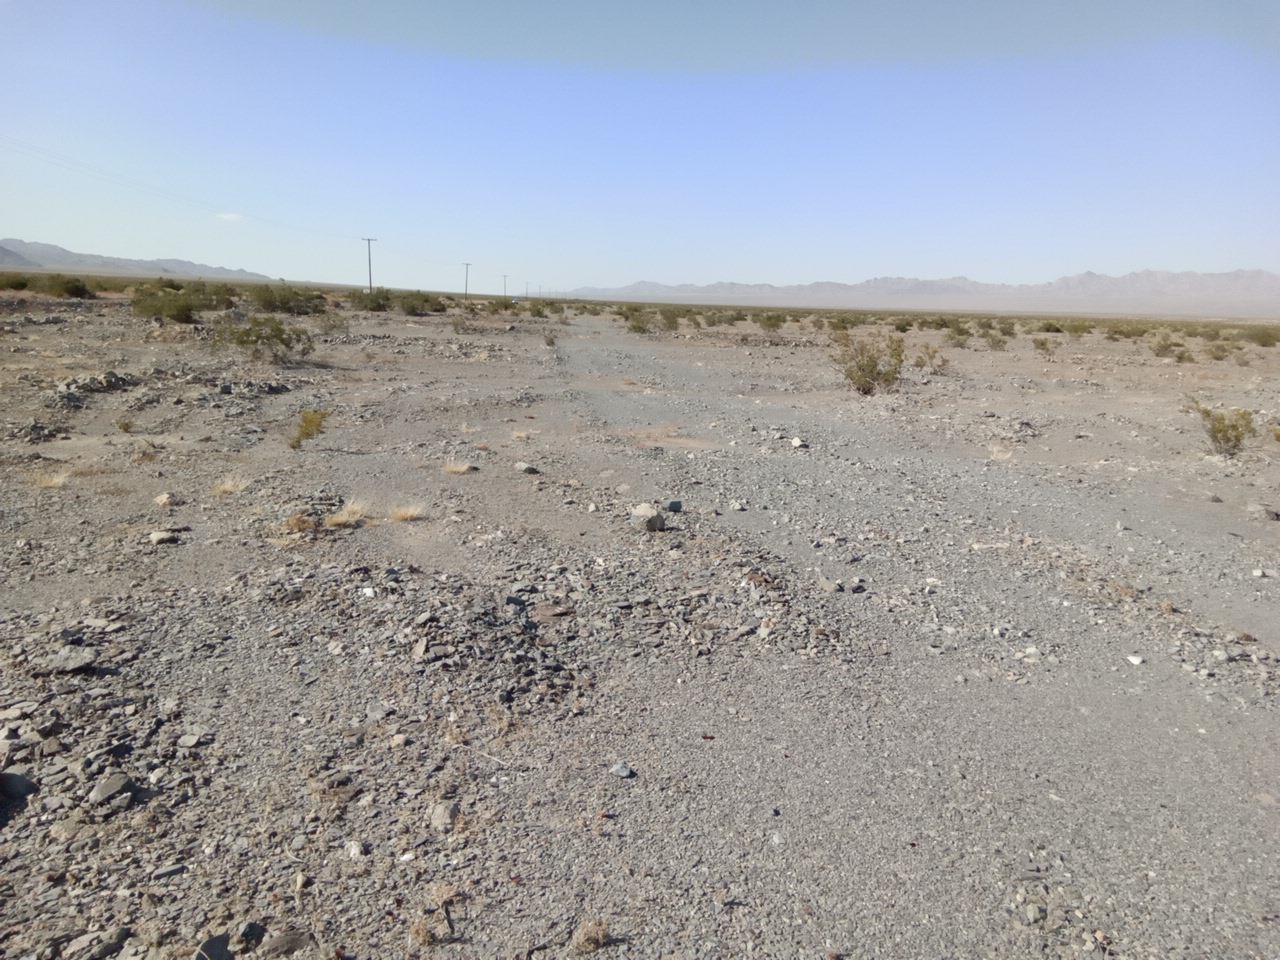
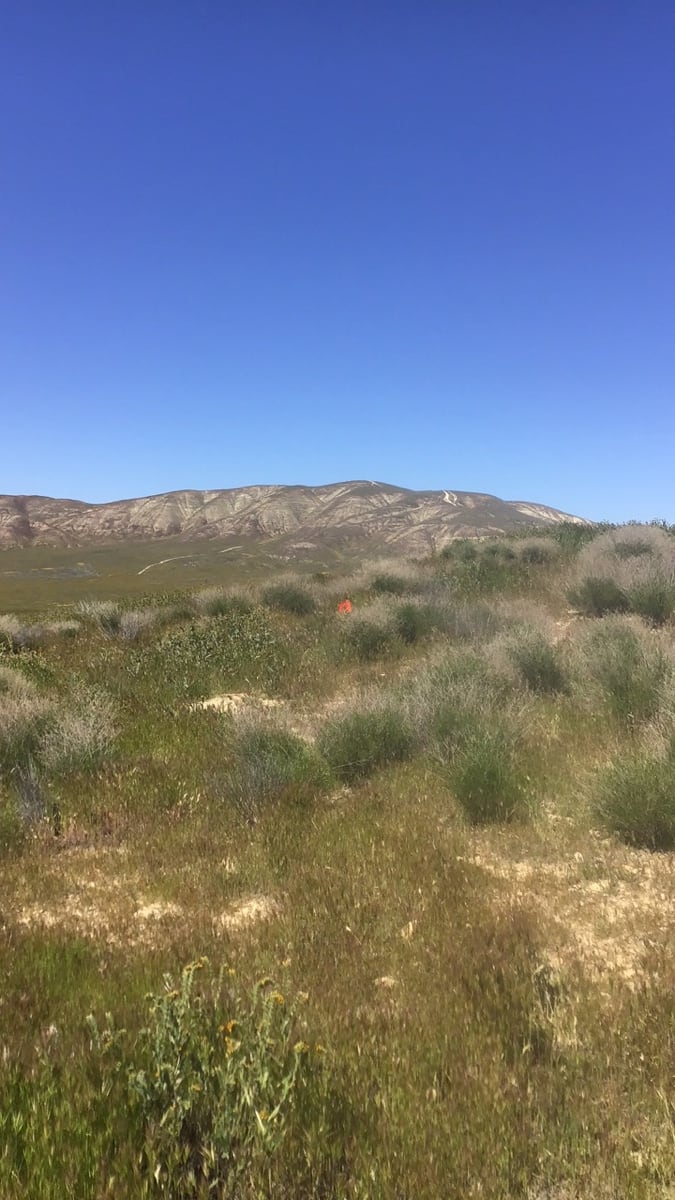
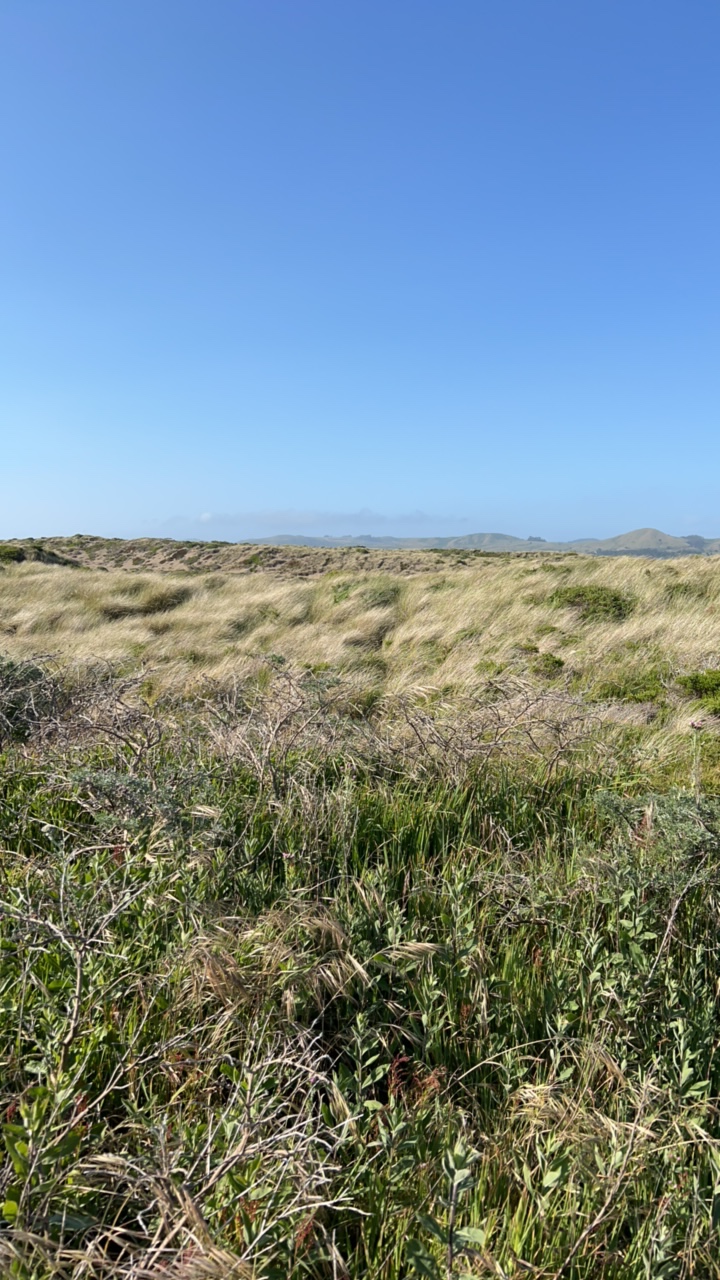
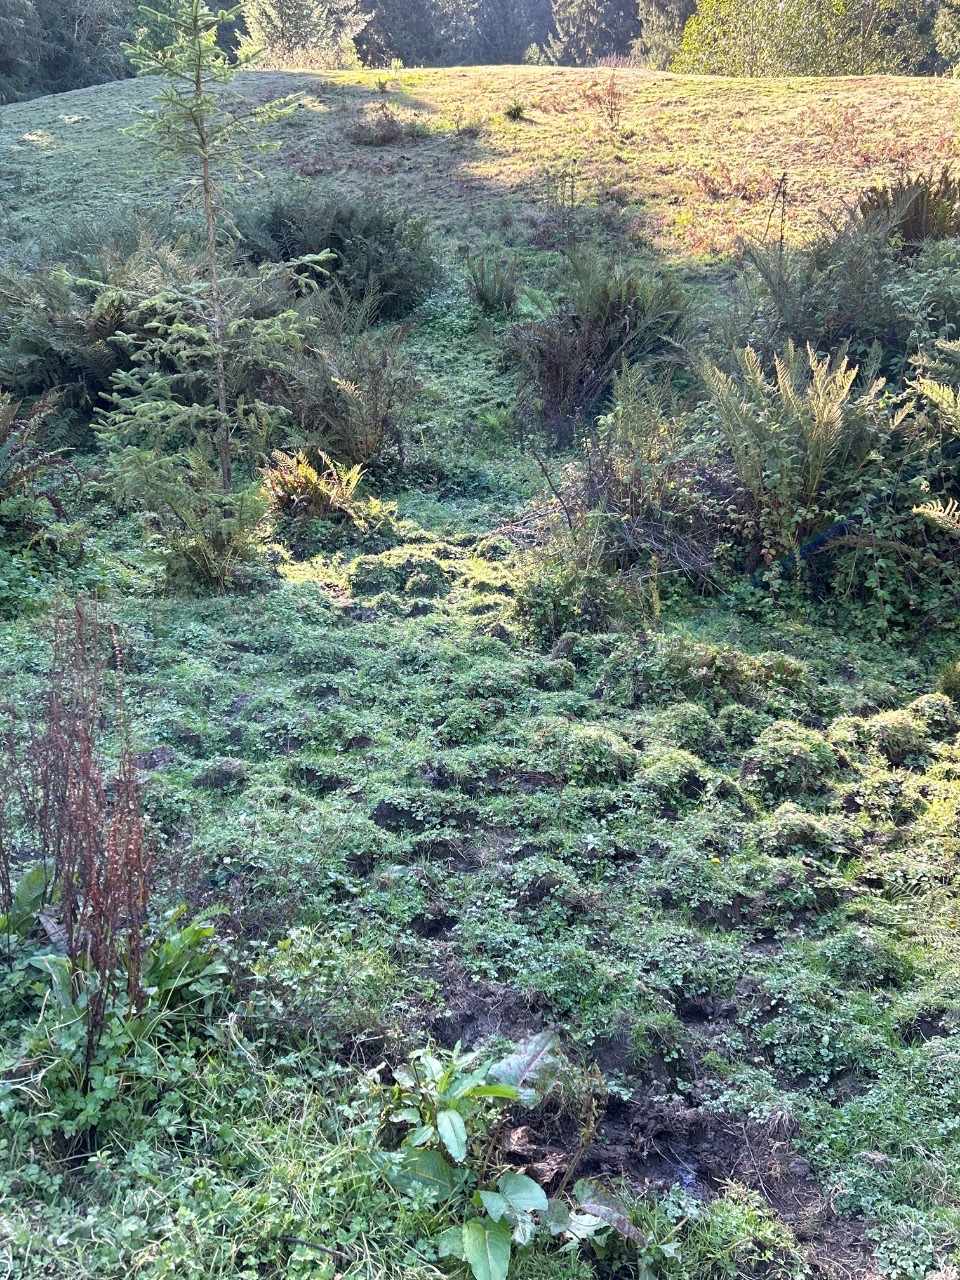
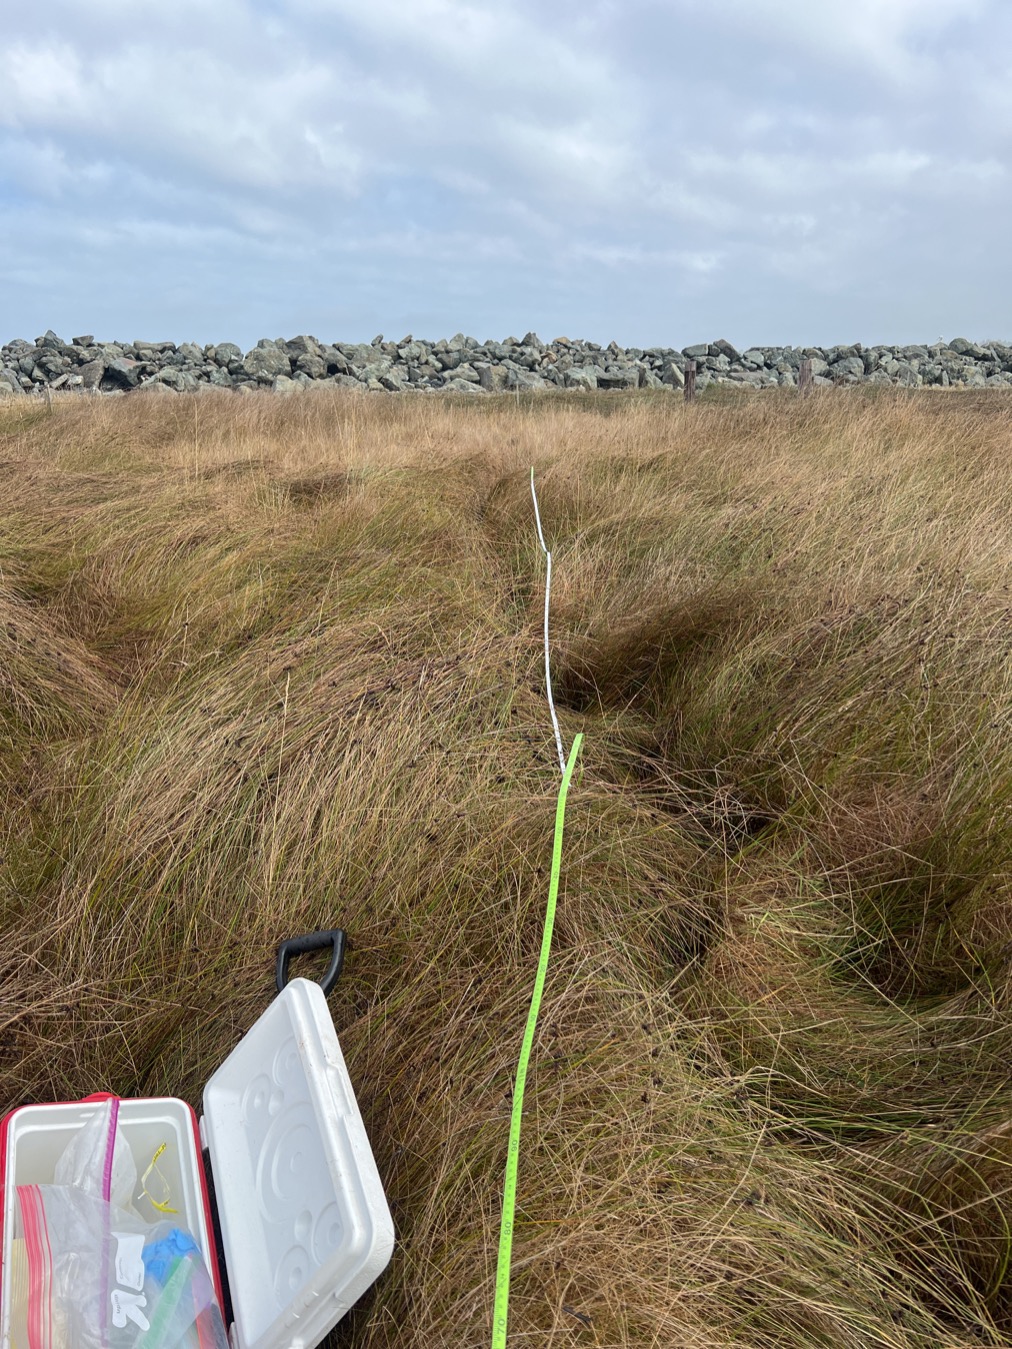
Image 1 of 15: Coastal redwood field site
Field and lab counts: Airtable operational snapshot, last verified Oct 2, 2026.
Each parent sample appears once at the furthest phase supported by connected evidence. These counts are evidence summaries, not a physical inventory or proof that every route is complete.
A zero means no sample has this as its furthest verified position. It does not prove the work did not occur.
One field sample can produce several aliquots that move through different labs at different times. This overview counts the parent once.
A parent sample is assigned to one phase only. Later evidence does not fill an unrecorded earlier phase or imply that every aliquot route is complete.
Each count represents one deduplicated parent sample identity at the furthest phase supported by connected occurrence, lab, custody, eDNA, output, or release evidence.
Destination routing does not prove that processing began or finished. Missing evidence remains missing rather than being interpreted as work not performed.
Dataset #30 barcode results remain outside the sample journey until specimen identifiers are cross-walked. Candidate, accepted, and publicly released identifications remain separate.
Evidence basisConnected field, occurrence, lab, custody, eDNA, processing-output, and release records.
Barcode specimens and eDNA detections answer different questions. They are presented separately so a sequence-bearing record is never mistaken for a species-level identification.
Swipe to compare barcode and eDNA evidence.
One loaded record represents one specimen with barcode sequence evidence. Taxonomic resolution varies by record.
A specimen can carry a DNA barcode while its best available identification remains at genus, family, or another broader rank. Multiple specimens can also share one species-level name. The dashboard keeps specimen records and distinct species names separate.
3 eDNA datasets are active. A detection is a marker-specific analytical result, not another physical sample.
Detection totals are reported separately by assay marker. They should not be added to specimen barcode records or interpreted as isolated organisms.
Processing provenanceBioKEA performed the wet-lab work and operated the Oxford Nanopore Technologies (ONT) sequencer for Dataset #31. Review the processing evidence.
Explore 234,201 canonical, georeferenced terrestrial and inland records in California from 18 enabled external DataONE datasets. Records remain visible at every available taxonomic resolution; marine and unclassified records have separate views.
California BOLD export #4 is included: 204,331 occurrence records, including 171,740 Insecta records. 187,089 records have coordinates, including 98,075 within the displayed California extent. Of the in-map records, 54,881 do not have a species-level name and still remain in the occurrence layer. Dataset #30 contributes 964,879 barcode-bearing records to the separate barcode-evidence section above, but its loaded FASTA headers contain no coordinates, so those records are not plotted.